


Test Observability vs. Test Monitoring: What QA Leaders Should Know

Your test passed, but production failed. Sound familiar? This is the reality for many QA leaders working in distributed systems. Dashboards might show that test suites passed, yet customers still hit performance issues or functional failures in production.
Traditional monitoring is good at raising alerts, but it rarely tells the full story. In microservices-heavy, CI/CD-driven environments, QA teams need more context than “15% of tests failed.” They need to know why tests fail, which dependency caused it, and how it ties to user journeys. That’s the promise of observability.
This blog explains observability vs monitoring, how telemetry completes the picture, the metrics QA leaders should track, and the tools to get started. By the end, you’ll know how to integrate observability into your QA strategy for deeper insights.
Observability vs Monitoring – What’s the Difference?
Monitoring: The Known Knowns
Monitoring is about predefined metrics and thresholds. In testing, this includes:
- Pass/fail counts across runs
- Execution times and throughput
- Defect density trends
Monitoring is reactive. A dashboard shows 15% regression failures or that response times exceeded 3 seconds. Helpful, yes, but limited. It’s like a car warning light, you know something’s wrong, but not why.
Observability: The Unknown Unknowns
Observability goes beyond static metrics. It’s about analyzing logs, traces, and signals to uncover unexpected behavior. QA teams use it to answer:
- Why tests fail intermittently
- Which microservice bottleneck caused API timeouts
- How infrastructure shifts affect performance trends
Observability is proactive. Instead of only reporting failures, it provides root cause insights.
Quick Answer Box
What is observability vs monitoring?
Monitoring tells QA teams what broke. Observability reveals why it broke and how to prevent it.
Observability vs Monitoring – Comparison and Examples
Key Comparison Table
| Aspect | Monitoring | Observability |
|---|---|---|
| Focus | Known metrics | System behavior |
| QA Use Case | Test execution status | Test failure analysis |
| Data Type | Predefined KPIs | Logs, traces, high-cardinality data |
| Problem Detection | “Test failed at 3:45 PM” | “Test failed due to API timeout under load” |
| Approach | Reactive alerts | Proactive investigation |
Practical QA Examples
- Monitoring Example: A dashboard shows 15% test failures in your CI/CD pipeline.
- Observability Example: Traces reveal that all failures map back to database connection pool exhaustion when 200 parallel tests ran.
This shift mirrors how CI/CD pipelines with Jenkins evolved, teams no longer settle for “it failed,” they need traceability to root cause.
Observability vs Monitoring vs Telemetry: The Complete Picture
What is Telemetry?
Telemetry is the automated collection and transmission of data. It’s the backbone for both monitoring and observability. In QA, telemetry includes:
- Execution logs
- Performance metrics
- Error traces
How They Work Together
- Telemetry collects data.
- Monitoring watches predefined KPIs from that data.
- Observability analyzes and correlates to explain failures.
Telemetry vs Observability
Telemetry is the raw exhaust; observability is the ability to interpret it.
Consider how test data in SAP environments requires monitoring pipelines and observability to spot anomalies across integration layers.
Observability Metrics in Testing
Essential Test Observability Metrics
- Test Flakiness Score: Measures intermittent failures across runs.
- Environment Health Indicators: CPU, memory, and container states during tests.
- Dependency Performance: API response times, DB queries, third-party services.
- User Journey Completion: End-to-end transactions like login → checkout.
Beyond Traditional Metrics
Observability adds depth by tracking:
- Correlation of code changes with test stability
- Degradation trends across releases
- Utilization patterns of test infrastructure
Beyond standard KPIs, forward-looking QA teams also track correlation depth metrics. These measure how well different telemetry signals (logs, traces, metrics) line up with observed failures. For instance, if a flaky test always aligns with a spike in API retries, that’s a correlation worth prioritizing. Another emerging metric is user-impact mapping, where test outcomes are connected directly to revenue-related journeys like checkout or claims processing.
Some teams also track observability coverage scores, showing what percentage of their test suites are instrumented with traces or detailed logs. This prevents blind spots where tests pass, but supporting telemetry is absent. The result? Better prioritization of fixes and stronger trust in automated pipelines.
Implementation Tip
Start with observability on your most business-critical flows, payments, onboarding, claims, then expand.
This is where building a future-proof test automation architecture becomes crucial, ensuring observability is embedded from the start.
APM vs Observability: Understanding the Evolution
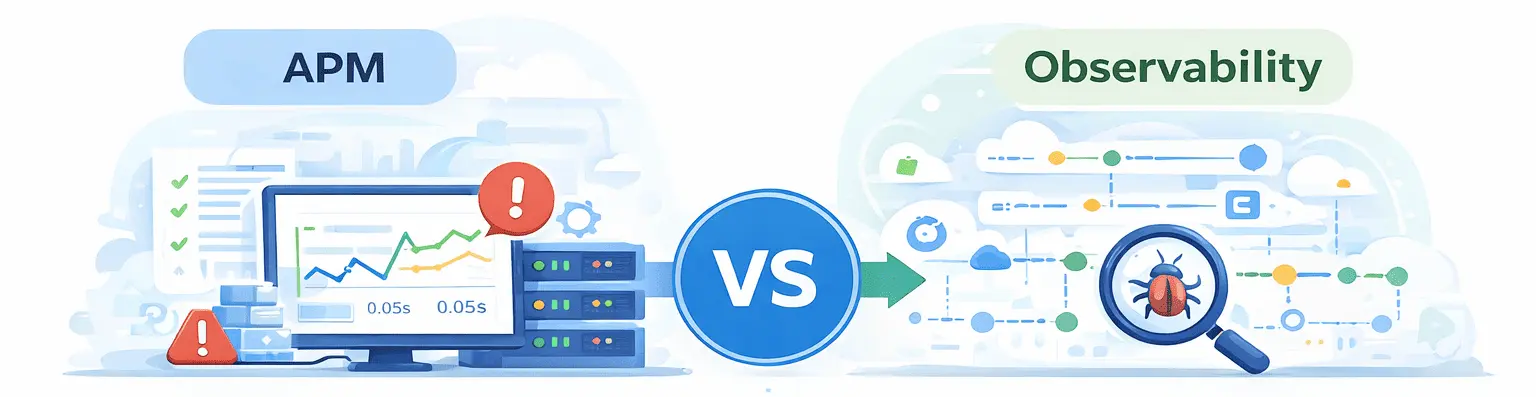
Application Performance Monitoring (APM)
APM tracks application metrics like throughput, error rates, and response times. It works for monoliths but struggles with distributed, API-heavy architectures.
Why Observability Supersedes APM
Observability tracks interactions across microservices, cloud layers, and test environments. It connects cause and effect.
For QA Teams
APM tells you the app is slow. Observability shows which microservice or API call failed during a specific test scenario.
This evolution is similar to how codeless AI testing for iconic apps went beyond scripted approaches to add depth and context.
Data Observability Tools for QA Teams
This means that, along with other ecosystem-related aspects like maturity and community adoption, one should also consider it while evaluating data observability tools. Take OpenTelemetry, A vendor-neutral no-brainer that has become a de facto standard in short order, or Grafana k6 is the go-to when it comes to real-world load testing and integration.
New Relic & Dynatrace both have advanced AI-driven anomaly detection on the enterprise side, but it tends to be more expensive to license. For most teams the sweet spot in between is tools, where they can slowly start adopting them, begin with open-source tracing, and then build on top of commercial platforms for enterprise-wide scale. Wrapping in stacks, like ACCELQ, guarantees that observability information is more than just a dashboard; however, it must feed instantly into the test design and automation techniques.
Key Tool Categories
- Open Source: OpenTelemetry, Jaeger, Prometheus
- Commercial: Datadog, New Relic, Dynatrace
- Test-Specific: Grafana k6, Elastic APM
Selection Criteria for QA
- Integration with test frameworks
- Support for distributed tracing
- Ability to define custom metrics
- Cost-effectiveness for staging environments
ACCELQ Integration Advantage
Platforms like ACCELQ already integrate test telemetry with observability stacks, enabling seamless test-to-insight pipelines. This ensures QA leaders don’t just monitor failures but analyze context.
For comparison, crowdsourced testing is another way to surface unexpected issues, but data observability gives you the technical “why” behind those issues.
📈 Elevate Your Software Quality Testing
Deliver Flawless Applications with ACCELQ
Try Now
Implementation Best Practices
Start Small, Scale Smart
Instrument your most critical test suites first. Expand coverage gradually across microservices.
Collaboration is Key
QA should collaborate with DevOps testing when choosing tools. Shared dashboards across testing, development, and ops eliminate silos.
Measure Success
Key KPIs for observability adoption include:
- Reduced mean time to resolution (MTTR)
- Decreased flakiness rates
- Faster root cause identification
This aligns closely with shift-left testing in Agile, as observability ensures that early feedback loops aren’t lost once systems reach production.
Conclusion: Why QA Needs Both
Observability vs monitoring isn’t a replacement debate; it’s about maturity. Monitoring highlights failures, and observability uncovers root causes. Together, they create complete quality visibility across pipelines.
As QA leaders, your priority is not just knowing that tests fail, but why they fail and how to prevent it from recurring. That’s where observability metrics, telemetry, and modern tools step in.
The future is clear: AI-driven observability will accelerate insights, turning test data into test intelligence. Platforms like ACCELQ are already embedding observability into automation workflows to shorten the gap between failure detection and resolution.
👉 Ready to take your QA strategy deeper? Explore how ACCELQ’s Autopilot intelligent automation platform extends monitoring with observability for faster, smarter quality insights.


Prashanth Punnam
Sr. Technical Content Writer
With over 8 years of experience transforming complex technical concepts into engaging and accessible content. Skilled in creating high-impact articles, user manuals, whitepapers, and case studies, he builds brand authority and captivates diverse audiences while ensuring technical accuracy and clarity.

You Might Also Like:
 Test Dashboards in Agile Software Development
Test Dashboards in Agile Software Development
 A Quick Guide to Continuous Testing in DevOps
A Quick Guide to Continuous Testing in DevOps
 TOP 15 Test Management Tools