







Network Testing Tools: Monitoring, Alerts, and Test Intelligence Compared
Picture a logistics company whose shipment-tracking dashboard passed every test run – green pipeline, correct data on screen. Then the cloud bill arrived 40% higher than forecast. A pagination bug was silently retrying an API call on every page load. No functional test caught it, because every individual response was technically correct.
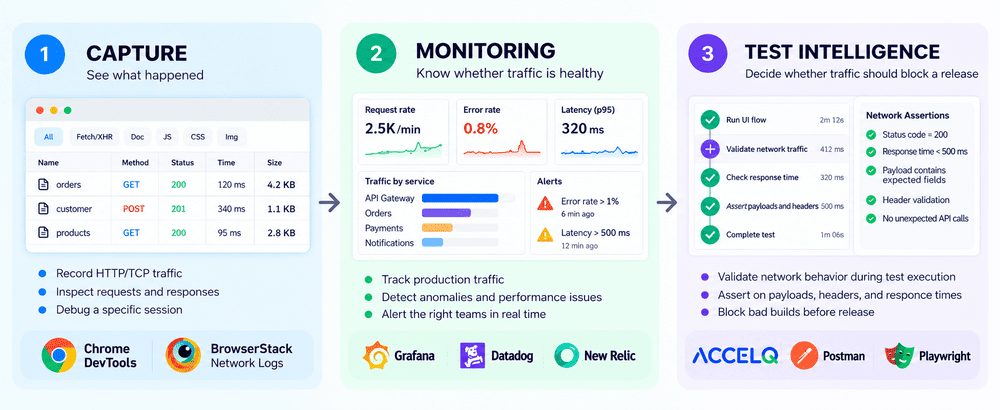
Network testing tools fall into three categories: capture tools (Chrome DevTools, BrowserStack) record raw traffic for manual debugging; monitoring platforms (Grafana, Datadog, New Relic) track production traffic and fire alerts; and automation platforms with network log analysis (ACCELQ, Postman, Playwright) assert on traffic during test execution. Most teams need at least one from each.
That gap, between “the test passed” and “the traffic behind it was healthy,” is what network testing tools exist to close. The problem most teams run into isn’t a lack of tools. It’s picking tools that only cover one of the three jobs the work actually requires: watching traffic, alerting on it, and turning it into evidence a test suite can act on.
- What Is Network Testing?
- What Software Options Are Available for Comprehensive Network Testing?
- What Are the Three Layers Every Network Testing Stack Needs?
- What Are the Best Network Capture Tools?
- What Are the Best Network Testing Tools for Monitoring
- How Do You Set Up Alerting for Network Testing?
- Which Automated Network Testing Tools Include Built-In Test Intelligence?
- How Does ACCELQ Analyze Network Logs in Web Automation Testing?
- Network Testing Tools Comparison: Monitoring, Alerts, and Test Intelligence
- How to Choose Network Testing Tools for QA Automation
- What's the Right Network Testing Stack for Your Team?
Capture, monitoring, and test intelligence solve different problems, and treating them as interchangeable is where most stacks break down. Each point below flags a specific gap: what a tool can tell you versus what it can’t, when an issue gets caught relative to release, and how common the resulting blind spot really is. None of these gaps close by adding another dashboard.
- Capture is not the same as validation. A tool that records network logs (BrowserStack, Chrome DevTools) tells you what happened. It doesn’t tell you whether what happened was acceptable, and it doesn’t fail a build on its own.
- Monitoring catches production drift; test intelligence catches it before release. Observability platforms are built to alert operations teams after traffic changes. Network log analysis tools embedded in automation platforms are built to assert on that same traffic during CI/CD, before it reaches a user.
- Fragmentation is the default, not the exception. Postman’s 2025 State of the API Report found monitoring tool adoption split across Grafana (36%), Sentry (20%), and Elastic (20%), with 17% of teams running no monitoring tooling at all, a gap the report calls critical as APIs carry more business and AI agent traffic.
What Is Network Testing?
Network testing validates how applications communicate across APIs, services, browsers, and external dependencies. It can include examining requests and responses, headers, payloads, retries, latency, and traffic patterns to identify problems that functional tests alone may not expose.
What Software Options Are Available for Comprehensive Network Testing?
Comprehensive network testing requires software across three layers: traffic capture tools that record HTTP/TCP activity, monitoring platforms that track that traffic in production, and test automation platforms with built-in network log analysis that assert on traffic during test runs. No single layer covers what the other two do.
Capture tools like Chrome DevTools’ Network panel or BrowserStack’s HAR-based logging are the starting point most engineers reach for first. They’re free or bundled, and they answer “what happened during this one session.” They stop being useful the moment you need that answer automatically, on every build, without a human opening a dashboard.
Monitoring platforms pick up where capture tools stop, but they’re built for production, not pre-release validation. They watch live traffic and page an on-call engineer when something breaks. That’s a different job from stopping a broken build before it ships, which is where automated network testing tools come in.
For the broader landscape these tools sit inside, see our roundup of API testing tools, which covers the contract and functional layers this piece doesn’t.
What Are the Three Layers Every Network Testing Stack Needs
Teams evaluating network testing tools for QA automation tend to compare products feature-by-feature, which misses the actual gap. The more useful lens is capability layer: does this tool monitor, does it alert, and does it feed test intelligence back into your pipeline?
- Monitoring answers “is traffic healthy right now.”
- Alerts answer “who needs to know, and how fast.”
- Test intelligence answers the harder question: “should this traffic pattern block a release.”
A tool that’s strong on one layer is frequently weak or absent on the other two, which is exactly why most engineering teams run more than one tool side by side rather than consolidating into a single platform.
This gets harder, not easier, as architecture spreads work across services. Our guide to microservices test automation covers why validating each service in isolation still leaves the traffic between them unchecked.
What Are the Best Network Capture Tools?
Capture tools record network activity from a specific browser, device, or test session. They are useful for investigating requests, responses, headers, and payloads after a failure, but they are not designed to continuously monitor production traffic.
| Tool | What it captures | Best for |
|---|---|---|
| Chrome DevTools | Browser request and response activity | Manual debugging |
| BrowserStack Network Logs | HAR-based network traffic from test sessions | Debugging cross-browser and real-device failures |
What Are the Best Network Testing Tools for Monitoring
Monitoring tools are built to observe live or staged traffic continuously and surface anomalies as they happen, rather than at a single point in time.
| Tool | What It Monitors | Best For |
|---|---|---|
| Grafana | Custom dashboards over metrics, logs, and traces from multiple sources | Teams that already run Prometheus or a mixed observability stack |
| Datadog | Full-stack APM, network performance, and synthetic API monitoring | Enterprises wanting one platform across infrastructure and application traffic |
| New Relic | Application performance monitoring with distributed tracing | Teams prioritizing root-cause analysis across microservices |
| Sentry | Error and performance monitoring at the application layer | Teams already using Sentry for error tracking who want traffic context alongside it |
Grafana’s leading adoption share isn’t a coincidence. Postman’s 2025 State of the API Report found it’s the most-used monitoring tool among API teams, ahead of Sentry and Elastic, largely because it plugs into whatever metrics pipeline a team already runs rather than demanding a new one.
How Do You Set Up Alerting for Network Testing?
The strongest network testing setups pair a monitoring source with a dedicated notification layer – Datadog or New Relic thresholds routed through PagerDuty or Opsgenie, or Postman’s traffic-based alerts through Slack and Teams.
Alerting is where monitoring becomes actionable. A dashboard nobody watches is functionally the same as no monitoring at all, which is part of why the 17% of API teams running zero monitoring tooling remain exposed to the same silent-degradation problem regardless of how good their functional tests are.
More alerts isn’t automatically better. Grafana Labs’ 2026 Observability Survey, drawing on more than 1,300 practitioners across 76 countries, found alert fatigue is the single biggest obstacle to fast incident response, named nearly twice as often as any other challenge. A tool that fires on every anomaly trains teams to ignore it, which is the same failure mode behind the flaky tests engineers learn to rerun instead of investigate.
Which Automated Network Testing Tools Include Built-In Test Intelligence?
This is the layer most engineering teams under-invest in, because it requires network log analysis to happen inside test execution rather than after deployment. When network assertions run inside CI/CD, failures can become release signals instead of post-release debugging tasks.
| Tool | Test Intelligence Capability | Codeless |
|---|---|---|
| ACCELQ | Captures and asserts on network behavior in the same flow as UI/API tests; validates request/response integrity, headers, and payload data without scripting | Yes |
| Postman / Newman | Collection-based assertions against live and mocked APIs, with Postman Insights surfacing traffic anomalies (error rates, latency, endpoint-level drift) | Partial |
| Playwright / Cypress | Native request interception (page.route, cy.intercept) lets teams assert on and mock network calls inline with UI tests |
No |
| WireMock | Simulates provider responses so consumer teams can test network behavior before a live dependency exists | No |
Cypress and Playwright’s interception APIs are genuinely strong for developer-owned suites; see our comparison of Cypress alternatives for where scripted interception starts to strain on mixed-skill QA teams.
How Does ACCELQ Analyze Network Logs in Web Automation Testing?
Analyzing network logs inside a test flow, rather than as a separate debugging step, is the core distinction of ACCELQ’s approach to network log analysis in Web Automation Testing. According to ACCELQ’s own documentation, network log analysis in its Web Automation suite lets QA teams validate both UI actions and their corresponding API calls within a single test, catching backend issues that never surface in the interface.
The same capability supports performance monitoring by tracking response times and payload sizes as the test runs, and extends into security testing by inspecting headers and data transmission for unexpected exposure. Teams building tests for checkout flows, live dashboards, or multi-step forms get a codeless way to confirm the frontend and backend agree, without adding a second monitoring tool to the pipeline.
Network log analysis isn’t limited to real dependencies, either. When a provider isn’t ready or reliable enough to test against yet, ACCELQ’s virtualization can stand in for it and still react to what’s actually being sent.
Network Testing Tools Comparison: Monitoring, Alerts, and Test Intelligence
| Tool | Monitoring | Alerts | Test Intelligence | Runs Inside CI/CD |
|---|---|---|---|---|
| ACCELQ | Embedded in test flow | Via CI/CD failure | Strong, codeless | Yes |
| Grafana | Strong | Via integration | None | No |
| Datadog | Strong | Native | Limited (synthetic checks) | Partial |
| BrowserStack | Capture only | None | None | Partial |
| Postman | Moderate (Insights) | Native | Moderate | Yes |
| Playwright/Cypress | None | None | Moderate (scripted) | Yes |
No row in this table wins on every column, which is the point. A team running Datadog in production still needs a tool that asserts on network behavior before a build ships, and a team running ACCELQ or Playwright in CI/CD still benefits from production-side monitoring that Grafana or Datadog cover more completely.
How to Choose Network Testing Tools for QA Automation
- Match the tool to the moment, not the marketing: A capture tool that’s excellent for manual debugging (BrowserStack, Chrome DevTools) will not fail a build on its own; don’t expect it to replace CI/CD assertions.
- Confirm the tool runs inside your pipeline, not next to it: If network validation happens in a separate dashboard someone has to check, it will eventually stop being checked.
- Weigh coding overhead against team composition: Playwright and Cypress interception is powerful but scripted; codeless platforms like ACCELQ put the same assertions in reach of manual and automation testers on the same team.
- Don’t skip alerting because monitoring exists: A monitored system with no alert routing is a monitored system nobody responds to until a customer does.
Check for contract testing overlap, not redundancy: Contract testing validates schema shape; network log analysis validates the traffic cost and behavior behind that shape. Teams need both, not one instead of the other.
What’s the Right Network Testing Stack for Your Team?
The goal is not to replace monitoring or debugging. It is to move the network signals that matter for release decisions into the test itself. A complete network testing stack needs three tools working together: one that watches traffic, one that alerts on it, and one that asserts on it before release – no single platform reliably covers all three.
Teams that treat these as three separate purchases end up with three dashboards nobody fully trusts. Teams that pick a test automation platform with network log analysis built into the execution flow close most of that gap in one place. If you’re running network log automation, functional testing, and API validation across separate tools, ACCELQ brings monitoring-grade visibility directly into your test execution instead of adding a fourth tool to maintain.
FAQ's
What is the difference between network testing and API testing?
API testing primarily validates API behavior, requests, responses, and contract expectations. Network testing can extend beyond those assertions to examine traffic behavior such as retries, latency, payload size, headers, and interactions between frontend and backend components. The two approaches complement each other rather than replacing one another.
What are the best network testing tools for QA teams?
The best choice depends on the layer being addressed. Grafana and Datadog are strong options for monitoring; alerting can be handled through platforms such as Postman, PagerDuty, and integrated notification workflows; and ACCELQ is a strong option for codeless test intelligence that asserts on network behavior inside the same flow as functional tests.
What is network log analysis, and how is it different from network monitoring?
Network log analysis examines request and response data, headers, and payloads during a specific test or session to validate behavior. Network monitoring continuously observes live traffic patterns over time to detect drift or anomalies. Log analysis is typically scoped to a test run, while monitoring is ongoing.
Are automated network testing tools necessary if we already do API testing?
Yes, because API testing validates the contract and the shape of a request and response, while network testing tools validate the behavior behind fulfilling that contract, including retries, latency, and payload size. A response can pass every API assertion and still reveal a serious performance or security issue in its underlying network log.
Can codeless platforms replace scripted network testing tools like Playwright's interception API?
Not entirely; they serve different users. Scripted interception gives developers granular, code-level control. Codeless network log analysis in platforms like ACCELQ gives manual and automation testers the same validation without writing scripts, which matters most on mixed-skill QA teams.



Prashanth Punnam
Sr. Technical Content Writer
With over 8 years of experience transforming complex technical concepts into engaging and accessible content. Skilled in creating high-impact articles, user manuals, whitepapers, and case studies, he builds brand authority and captivates diverse audiences while ensuring technical accuracy and clarity.


You Might Also Like:
 Emulator Vs Simulator Vs Real Device: Mobile Testing
Emulator Vs Simulator Vs Real Device: Mobile Testing
 What Is Chaos Engineering? Principles, Best Practices, Advantages
What Is Chaos Engineering? Principles, Best Practices, Advantages
 Build Quality From Day One: Practical Techniques That Work